Hypothesis Testing
Chapter 8 will combine descriptive statistics from Unit 1 with the probability from sampling distributions in chapter 7 to evaluate claims. All hypothesis tests begin with a claim. Then, sample data are collected to see whether the claim appears reasonable, or if it appears to be incorrect. Using probability, we will decide whether we should reject the claim, or not reject it. See figure 8.2.
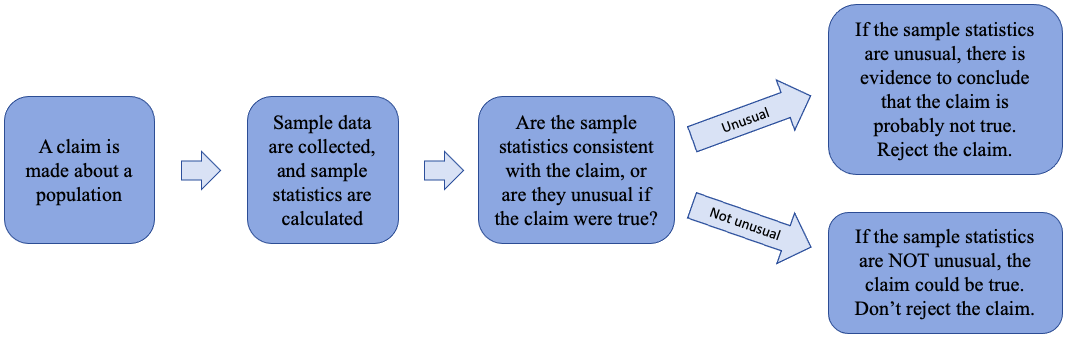
Figure 8.2: The logic of hypothesis testing
By the end of this chapter, you will be able to:
•Identify and interpret null and alternative hypotheses.
•Recognize a hypothesis test as
◦Left tail
◦Right tail
◦Two tailed
•Understand and describe the logic of hypothesis testing, including
◦Knowing when to reject the null hypothesis
◦P-value
◦Significance level
◦Test statistic
•Use the normal distribution to compute P-values for hypotheses about population proportions.
•Use the Student’s T-distribution to compute P-values for hypotheses about population means.
•Describe Type I and Type II errors in hypothesis testing.
•Use technology to complete hypothesis tests.
•Interpret the results of hypothesis tests.